Human Population Guided Viewing
Vocabulary
1. Demographics – The study of human populations
2. How much did the human population grow in the 20th century?
The human population tripled during the 20th century.
3. Exponential Growth –When population and growth rate both increase
4. Linear Growth-Only population rate increases, growth rate is steady.
5. Doubling Time –Estimation of how long for a population to double in size
6. Developing Countries –are poor, young, and rapidly growing.
7. Developed Countries –are wealthy, old, and mostly shrinking.
8. Fertility Rate-Number of births per 1000 women per year.
9. Total Fertility Rate –Average number of children a woman has in her lifetime.
10.Replacement Level – is when you have 2.1 children per couple
11. Emigration – Move out of an area
12. Immigration – Move into an area
13. Life Expectancy – Average age a newborn can expect to attain in any given society
14. Pronatalist Forces - Factors that increase the desire for children
15. Antinatalist Forces- Factors that decrease the desire for children
Critical Thinking
1. Fill out this summary chart showing the demographic divide Between developed and developing countries:
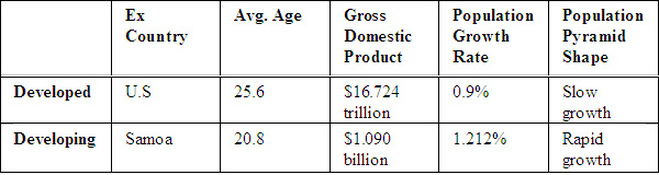
2. The majority of the world’s population is found in ( developed / developing ) countries.
Developing
3. What are the two factors that most affect life expectancy?
Mortality rates and poverty
4. Label each of these as example of antinatalist or pronatalist factors.
pronatalist- The son preference
pronatalist- Increased education levels of family.
antinatalist- Women having access to professional careers.
pronatalist- Family lives in a developing country
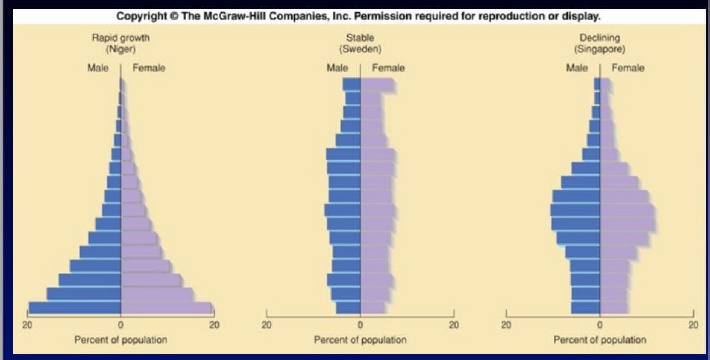
6. What is an age structure diagram (population pyramid)? Draw a pyramid representing each of the 3 “stages” (Rapid growth, Stable, Declining).
An age structure diagram shows distribution of ages in a population at a specific time.
An age structure diagram shows distribution of ages in a population at a specific time.
7. What is the projection of the future human population? Why is it not clear?
The projection is human population will either be 8 billion, 9 billion, etc. It is not clear because birth and death rates are expected to change
The projection is human population will either be 8 billion, 9 billion, etc. It is not clear because birth and death rates are expected to change
