Oh Deer Response
1. Name three essential components of habitat (things animals need to survive).
A. Food
B. Water
C. Shelter
2. Explain what caused the increase of “deer” during the activity you participated in.
The amount of resources every year, caused the increase of deer.
3. Explain what caused the decrease of “deer” during the activity you participated in.
What caused the decrease of deer, what the lack of resources since the deer population increased.
4. Define the term limiting factor. Give examples of limiting factors for the deer in our activity.
Limiting factor is what limits the population of species. Examples from the deer activity were food, shelter, and water.
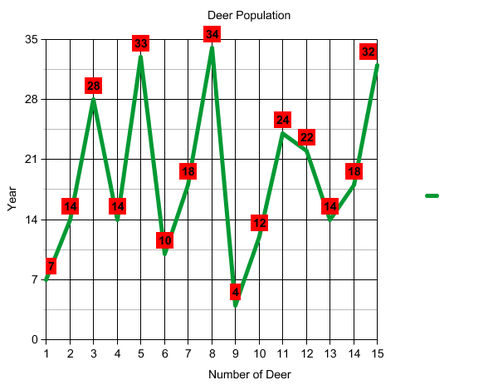
5. Graph the data from the activity and attach to this sheet (make sure to correctly title and label
the axes). Describe what the graph of our data looks like. How and why did our deer population change?
The graph has rapid increase and decrease of deer population every year. The changes of deer population is based on how much resources there are, and if there was a fire, drought, or predators.
A. Food
B. Water
C. Shelter
2. Explain what caused the increase of “deer” during the activity you participated in.
The amount of resources every year, caused the increase of deer.
3. Explain what caused the decrease of “deer” during the activity you participated in.
What caused the decrease of deer, what the lack of resources since the deer population increased.
4. Define the term limiting factor. Give examples of limiting factors for the deer in our activity.
Limiting factor is what limits the population of species. Examples from the deer activity were food, shelter, and water.
5. Graph the data from the activity and attach to this sheet (make sure to correctly title and label
the axes). Describe what the graph of our data looks like. How and why did our deer population change?
The graph has rapid increase and decrease of deer population every year. The changes of deer population is based on how much resources there are, and if there was a fire, drought, or predators.
6. Often we use the phrase “balance of nature” to describe a healthy ecosystem. Based on our graph, what does the “balance of nature” look like? Should we expect populations to be static (unchanging) or do they naturally fluctuate? Explain.
Based of the graph the balance of nature shows that there is a change in population every year based on how many resources are available. It also shows that there is a population flux over time because the amount of population affects the amount of resources, and the amount of resources affects the amount of population.
7. What did you learn about population dynamics by doing this activity?
What I learned was that population can flux over time based on the resources available, and that the amount of resources, and population of species affect one another causing a population flux. Also that every population of species has a carrying capacity based on resources.
